New reports in CleverStaff – Number of candidate sources and Sources efficiency
Looking for candidates in dozens of different sites, from social networks to thematic conferences – is daily work for recruiters. But how to track the effectiveness of these sources and applicants from there, how to strengthen the work with them and eliminate ineffective ones? New reports in CleverStaff will help you understand this issue.
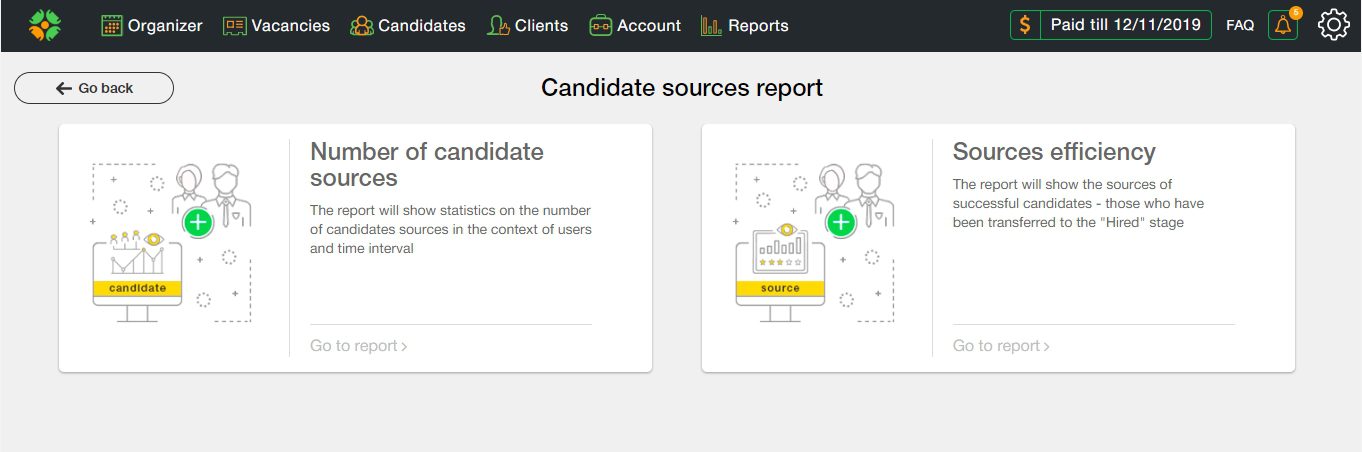
How report Number of candidate sources works
This report will be useful to both managers and team leaders. It shows a list of sources your recruiters are dealing with. You will see how many candidates they added from each source in the period you need. This gives an understanding of how carefully the different sites were processed to close a vacancy. You can get data for a certain period: this week, last week, current month, last month, current year, last year. To see this information, go to the Report → Number of candidate sources.
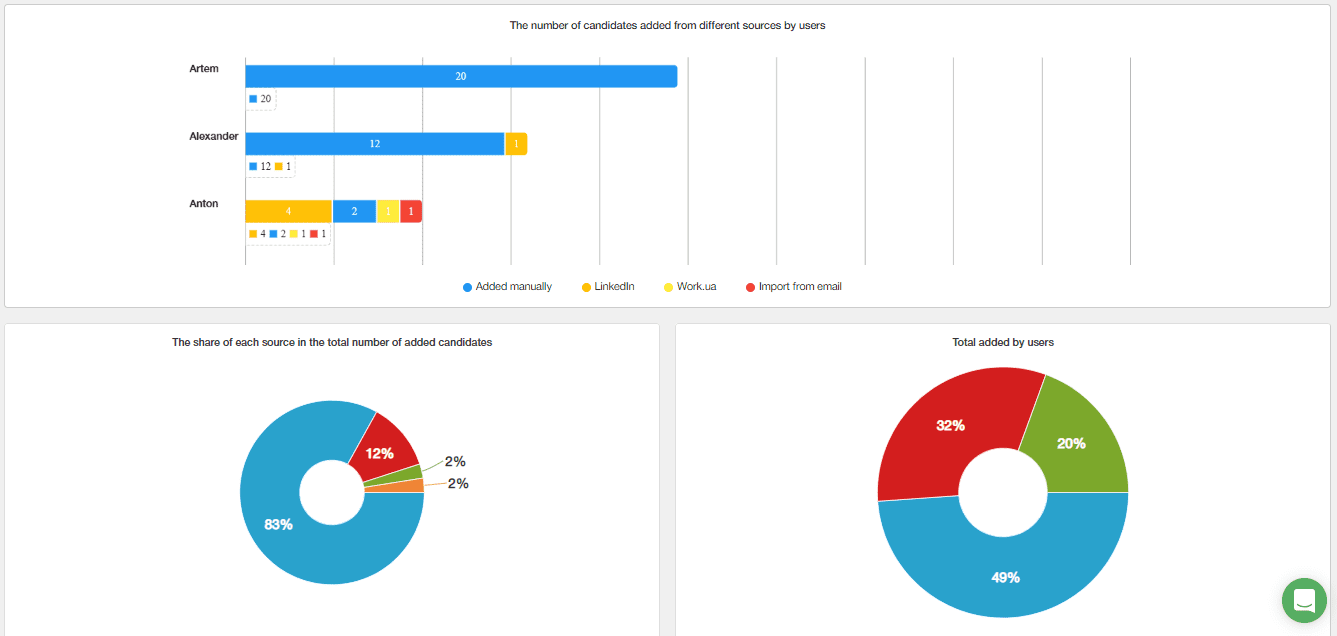
If you want to see how many sources a particular user has added, then switch the switcher, as shown in the screenshot, and click “Generate Report”. This information helps to analyze which sources and tools your colleagues and subordinates use more often. All data is displayed in a table, and also it is visualized in a diagram.
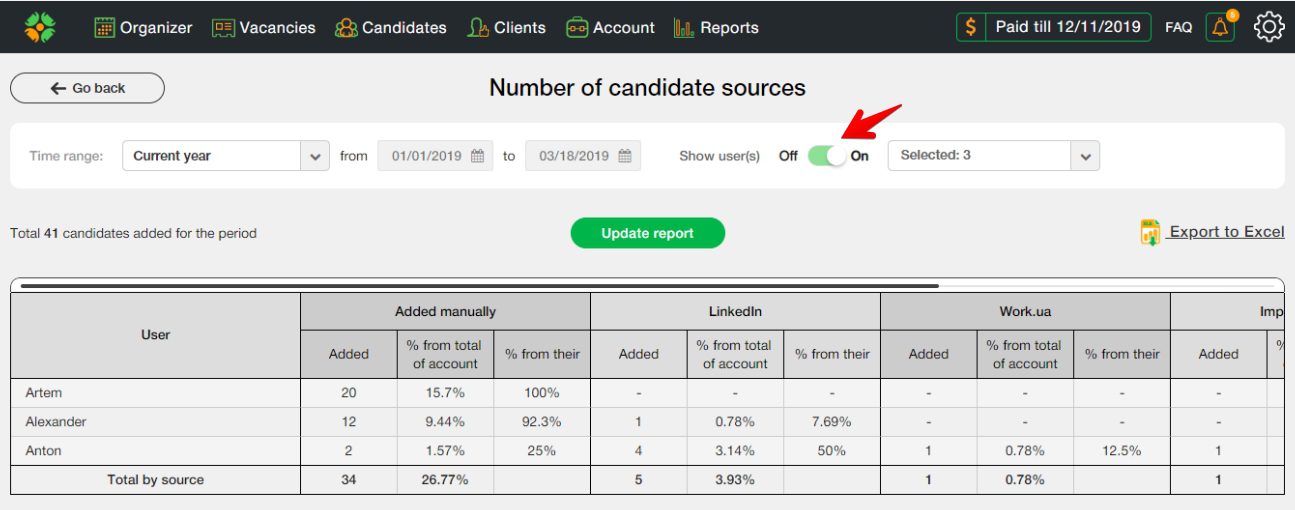
To download the report, click on the “Export to Excel” button. In Excel customization is still possible.
How Sources efficiency report works
This report shows which source was most effective for an certain vacancy and for a specific period of work. In one click you get information about how many candidates were added from a specific resource and how many received a job offer in sum. Such information provides an opportunity to see the result of the work and analyze how many high-quality CV’s were found using a specific source. This information will help to better know where exactly to look for the specialists you need.
Open “Reports” → “Sources efficiency”. To build a report, you should choose a time period: this week, last week, current month, last month, current year, last year. After clicking on the “Update report” button, a table will appear in front of you, as shown in the screenshot.
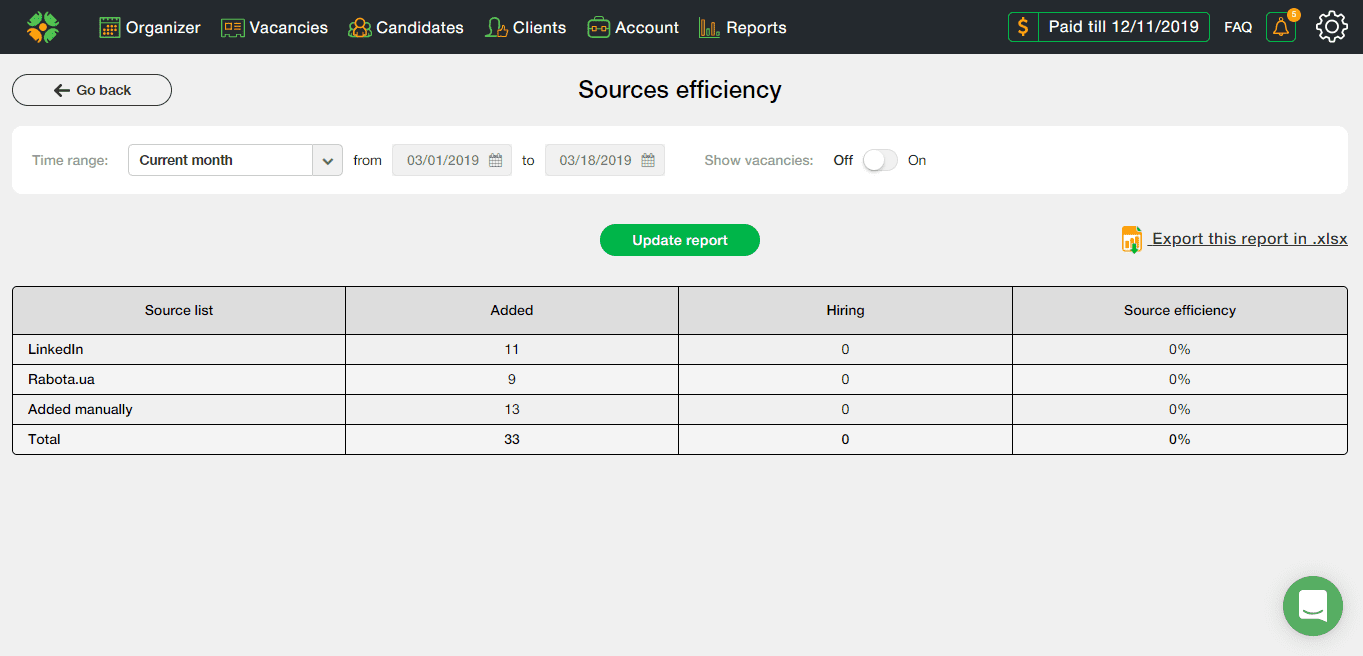
Hiring” column helps to see how many candidates were added from each of the sources, and how many candidates came to work as a result. Column “Vacancy” with the name of the position on which the work was carried out, can be removed. To do this, select “On / Off”, as shown in the screenshot.

The last column shows the percentage of added candidates and successful candidates. We would like to note that the report is based on a binding by the date the candidate was added. If you added a candidate last week, and he finally came to work this week, then as a successful candidate, he will appear in the report for the past week.
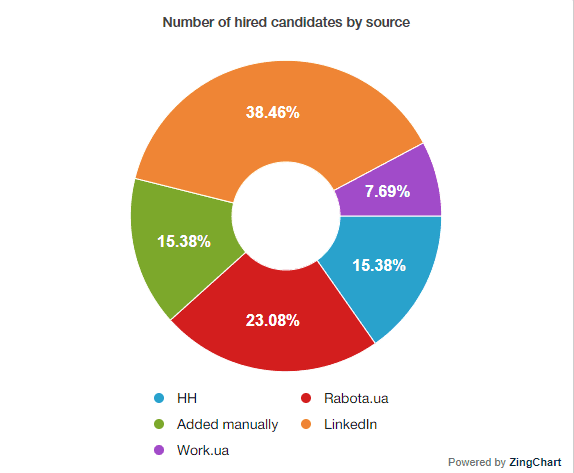
Under the spreadsheet, an additional diagram is displayed, which is a visualization of the sources from which more successful candidates came.
 To download the report, click on the “Export to Excel” button.
How to add the sources
To add sources, you need to go to your account → “List of sources”. On the right, there are a number of sources by default: HeadHunter, LinkedIn, Work.ua, Rabota.ua, “recommendation” and others. By clicking on the “Add source” button, you can add up to 20 of your options. Sources can be edited and even deleted. The remote source doesn’t disappear from the report, but it is displayed with the mark “Deleted by the administrator”.